Examples
Plotting isoelastics
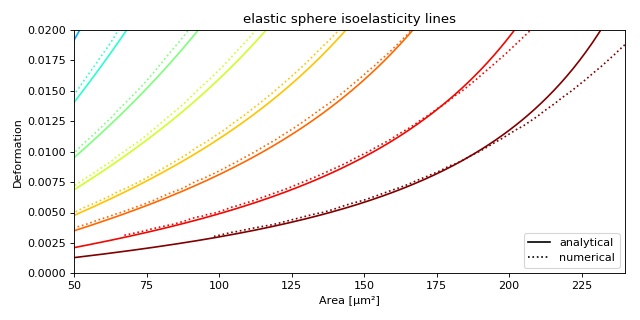
This example illustrates how to plot dclab isoelastics by reproducing figure 3 (lower left) of [MMM+17].
1 2 3 4 5 6 7 8 9 10 11 12 13 14 15 16 17 18 19 20 21 22 23 24 25 26 27 28 29 30 31 32 33 34 35 36 37 38 | import matplotlib.pylab as plt
import matplotlib.lines as mlines
from matplotlib import cm
import numpy as np
import dclab
# parameters for isoelastics
kwargs = {"col1": "area_um", # x-axis
"col2": "deform", # y-axis
"channel_width": 20, # [um]
"flow_rate": 0.04, # [ul/s]
"viscosity": 15, # [Pa s]
"add_px_err": False # no pixelation error
}
isos = dclab.isoelastics.get_default()
analy = isos.get(method="analytical", **kwargs)
numer = isos.get(method="numerical", **kwargs)
plt.figure(figsize=(8, 4))
ax = plt.subplot(111, title="elastic sphere isoelasticity lines")
colors = [cm.get_cmap("jet")(x) for x in np.linspace(0, 1, len(analy))]
for aa, nn, cc in zip(analy, numer, colors):
ax.plot(aa[:, 0], aa[:, 1], color=cc)
ax.plot(nn[:, 0], nn[:, 1], color=cc, ls=":")
line = mlines.Line2D([], [], color='k', label='analytical')
dotted = mlines.Line2D([], [], color='k', ls=":", label='numerical')
ax.legend(handles=[line, dotted])
ax.set_xlim(50, 240)
ax.set_ylim(0, 0.02)
ax.set_xlabel(dclab.dfn.feature_name2label["area_um"])
ax.set_ylabel(dclab.dfn.feature_name2label["deform"])
plt.tight_layout()
plt.show()
|