Notation
When coding with dclab, you should be aware of the following definitions and design principles.
Events
An event comprises all data recorded for the detection of one object (e.g. cell or bead) in an RT-DC measurement.
Features
A feature is a measurement parameter of an RT-DC measurement. For instance, the feature “index” enumerates all recorded events, the feature “deform” contains the deformation values of all events. There are scalar features, i.e. features that assign a single number to an event, and non-scalar features, such as “image” and “contour”. The following features are supported by dclab:
Scalar features
scalar features |
description [units] |
|---|---|
area_cvx |
Convex area [px] |
area_msd |
Measured area [px] |
area_ratio |
Porosity (convex to measured area ratio) |
area_um |
Area [µm²] |
aspect |
Aspect ratio of bounding box |
bright_avg |
Brightness average within contour [a.u.] |
bright_sd |
Brightness SD within contour [a.u.] |
circ |
Circularity |
deform |
Deformation |
emodulus |
Young’s Modulus [kPa] |
fl1_area |
FL-1 area of peak [a.u.] |
fl1_dist |
FL-1 distance between two first peaks [µs] |
fl1_max |
FL-1 maximum [a.u.] |
fl1_max_ctc |
FL-1 maximum, crosstalk-corrected [a.u.] |
fl1_npeaks |
FL-1 number of peaks |
fl1_pos |
FL-1 position of peak [µs] |
fl1_width |
FL-1 width [µs] |
fl2_area |
FL-2 area of peak [a.u.] |
fl2_dist |
FL-2 distance between two first peaks [µs] |
fl2_max |
FL-2 maximum [a.u.] |
fl2_max_ctc |
FL-2 maximum, crosstalk-corrected [a.u.] |
fl2_npeaks |
FL-2 number of peaks |
fl2_pos |
FL-2 position of peak [µs] |
fl2_width |
FL-2 width [µs] |
fl3_area |
FL-3 area of peak [a.u.] |
fl3_dist |
FL-3 distance between two first peaks [µs] |
fl3_max |
FL-3 maximum [a.u.] |
fl3_max_ctc |
FL-3 maximum, crosstalk-corrected [a.u.] |
fl3_npeaks |
FL-3 number of peaks |
fl3_pos |
FL-3 position of peak [µs] |
fl3_width |
FL-3 width [µs] |
frame |
Video frame number |
g_force |
Gravitational force in multiples of g |
index |
Event index (Dataset) |
index_online |
Event index (Online) |
inert_ratio_cvx |
Inertia ratio of convex contour |
inert_ratio_prnc |
Principal inertia ratio of raw contour |
inert_ratio_raw |
Inertia ratio of raw contour |
ml_class |
Most probable ML class |
nevents |
Total number of events in the same image |
pc1 |
Principal component 1 |
pc2 |
Principal component 2 |
pos_x |
Position along channel axis [µm] |
pos_y |
Position lateral in channel [µm] |
size_x |
Bounding box size x [µm] |
size_y |
Bounding box size y [µm] |
temp |
Chip temperature [°C] |
temp_amb |
Ambient temperature [°C] |
tilt |
Absolute tilt of raw contour |
time |
Event time [s] |
userdef0 |
User defined 0 |
userdef1 |
User defined 1 |
userdef2 |
User defined 2 |
userdef3 |
User defined 3 |
userdef4 |
User defined 4 |
userdef5 |
User defined 5 |
userdef6 |
User defined 6 |
userdef7 |
User defined 7 |
userdef8 |
User defined 8 |
userdef9 |
User defined 9 |
volume |
Volume [µm³] |
In addition to these scalar features, it is possible to define a large number of features dedicated to machine-learning, the “ml_score_???” features: The “?” can be a digit or a lower-case letter of the alphabet, e.g. “ml_score_rbc” or “ml_score_3a3”. If “ml_score_???” features are defined, then the ancillary “ml_class” feature, which identifies the most-probable feature for each event, becomes available.
Non-scalar features
non-scalar features |
description [units] |
|---|---|
contour |
Binary event contour image |
image |
Gray scale event image |
mask |
Binary region labeling the event in the image |
trace |
Dictionary of fluorescence traces |
Examples
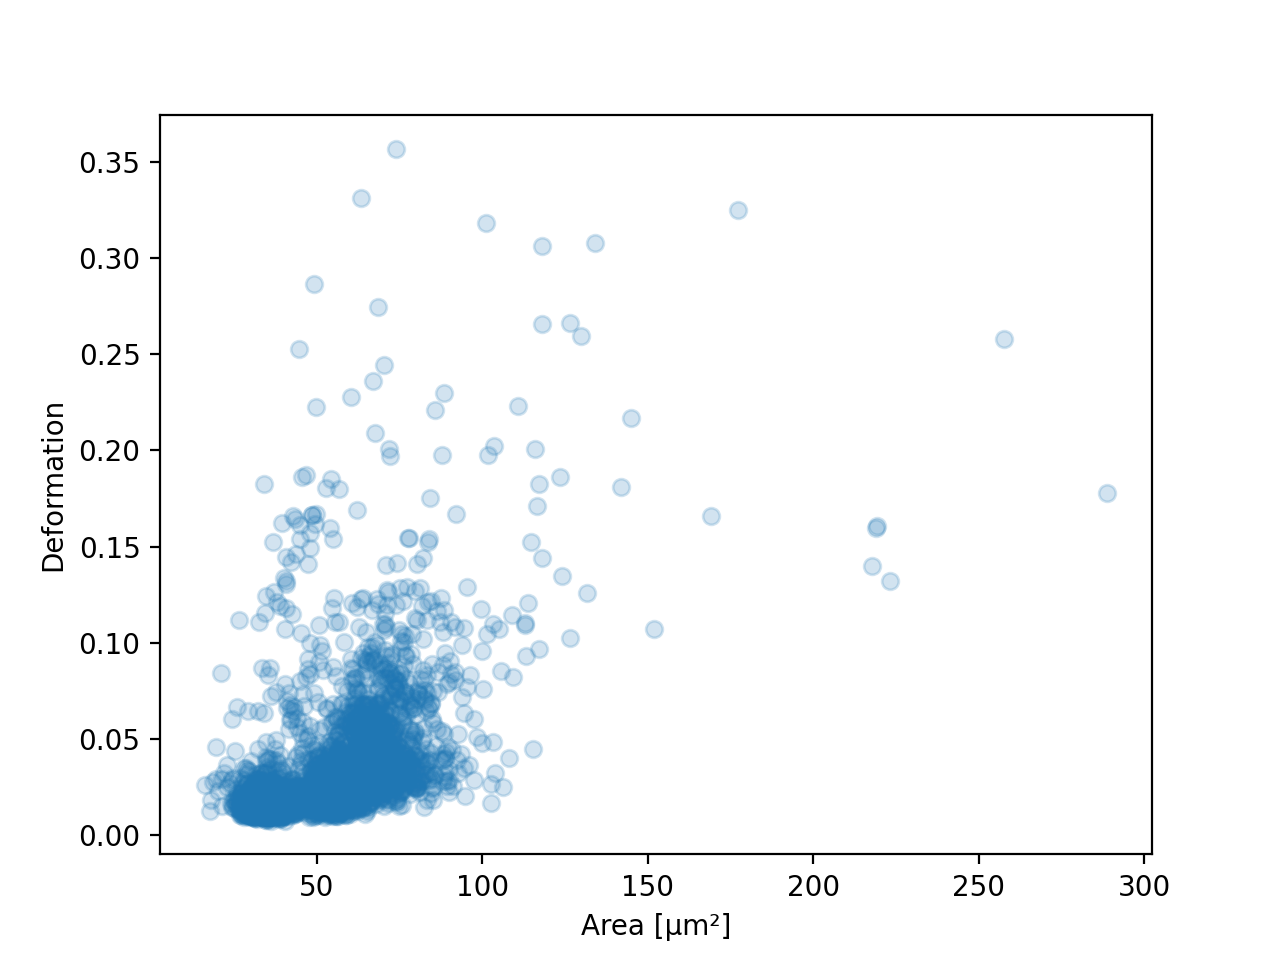
deformation vs. area plot
import matplotlib.pylab as plt import dclab ds = dclab.new_dataset("data/example.rtdc") ax = plt.subplot(111) ax.plot(ds["area_um"], ds["deform"], "o", alpha=.2) ax.set_xlabel(dclab.dfn.get_feature_label("area_um")) ax.set_ylabel(dclab.dfn.get_feature_label("deform")) plt.show()(Source code, png, hires.png, pdf)

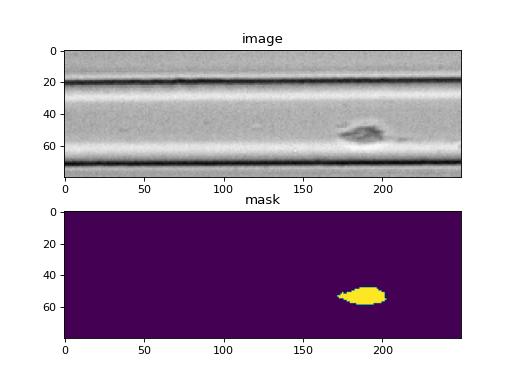
event image plot
import matplotlib.pylab as plt import dclab ds = dclab.new_dataset("data/example_video.rtdc") ax1 = plt.subplot(211, title="image") ax2 = plt.subplot(212, title="mask") ax1.imshow(ds["image"][6], cmap="gray") ax2.imshow(ds["mask"][6])(Source code, png, hires.png, pdf)

Ancillary features
Not all features available in dclab are recorded online during the acquisition of the experimental dataset. Some of the features are computed offline by dclab, such as “volume” or “emodulus”. These ancillary features are computed on-the-fly and are made available seamlessly through the same interface.
Filters
A filter can be used to gate events using features. There are min/max filters and 2D polygon filters. The following table defines the main filtering parameters:
filtering |
parsed |
description [units] |
|---|---|---|
enable filters |
Enable filtering |
|
hierarchy parent |
Hierarchy parent of the dataset |
|
limit events |
Upper limit for number of filtered events |
|
polygon filters |
Polygon filter indices |
|
remove invalid events |
Remove events with inf/nan values |
Min/max filters are also defined in the filters section:
filtering |
explanation |
|---|---|
area_um min |
Exclude events with area [µm²] below this value |
area_um max |
Exclude events with area [µm²] above this value |
aspect max |
Exclude events with an aspect ratio above this value |
… |
… |
Examples
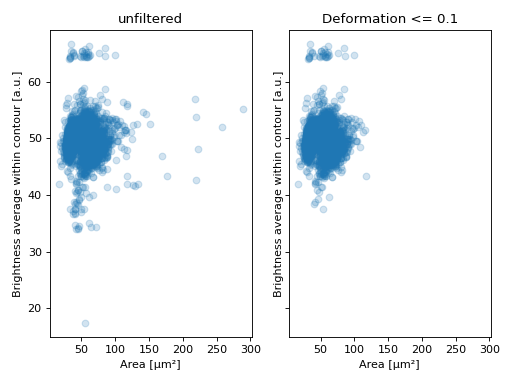
excluding events with large deformation
import matplotlib.pylab as plt import dclab ds = dclab.new_dataset("data/example.rtdc") ds.config["filtering"]["deform min"] = 0 ds.config["filtering"]["deform max"] = .1 ds.apply_filter() dif = ds.filter.all f, axes = plt.subplots(1, 2, sharex=True, sharey=True) axes[0].plot(ds["area_um"], ds["bright_avg"], "o", alpha=.2) axes[0].set_title("unfiltered") axes[1].plot(ds["area_um"][dif], ds["bright_avg"][dif], "o", alpha=.2) axes[1].set_title("Deformation <= 0.1") for ax in axes: ax.set_xlabel(dclab.dfn.get_feature_label("area_um")) ax.set_ylabel(dclab.dfn.get_feature_label("bright_avg")) plt.tight_layout() plt.show()(Source code, png, hires.png, pdf)
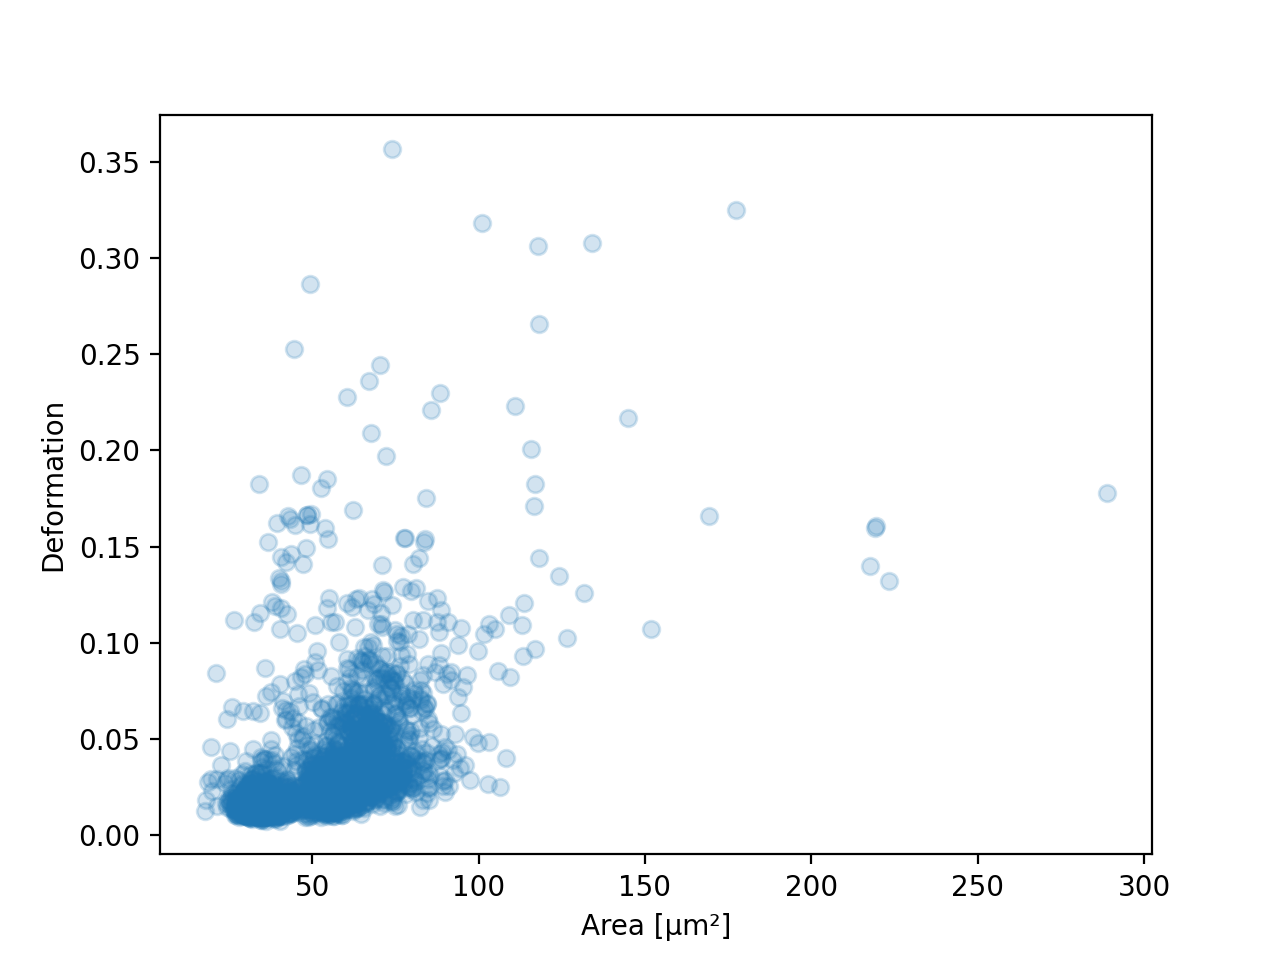
excluding random events
This is useful if you need to have a (sub-)dataset of a specified size. The downsampling is reproducible (the same points are excluded).
import matplotlib.pylab as plt import dclab ds = dclab.new_dataset("data/example.rtdc") ds.config["filtering"]["limit events"] = 4000 ds.apply_filter() fid = ds.filter.all ax = plt.subplot(111) ax.plot(ds["area_um"][fid], ds["deform"][fid], "o", alpha=.2) ax.set_xlabel(dclab.dfn.get_feature_label("area_um")) ax.set_ylabel(dclab.dfn.get_feature_label("deform")) plt.show()(Source code, png, hires.png, pdf)

Experiment metadata
Every RT-DC measurement has metadata consisting of key-value-pairs. The following are supported:
experiment |
parsed |
description [units] |
|---|---|---|
date |
Date of measurement (‘YYYY-MM-DD’) |
|
event count |
Number of recorded events |
|
run index |
Index of measurement run |
|
sample |
Measured sample or user-defined reference |
|
time |
Start time of measurement (‘HH:MM:SS[.S]’) |
fluorescence |
parsed |
description [units] |
|---|---|---|
bit depth |
Trace bit depth |
|
channel 1 name |
FL1 description |
|
channel 2 name |
FL2 description |
|
channel 3 name |
FL3 description |
|
channel count |
Number of active channels |
|
channels installed |
Number of available channels |
|
laser 1 lambda |
Laser 1 wavelength [nm] |
|
laser 1 power |
Laser 1 output power [%] |
|
laser 2 lambda |
Laser 2 wavelength [nm] |
|
laser 2 power |
Laser 2 output power [%] |
|
laser 3 lambda |
Laser 3 wavelength [nm] |
|
laser 3 power |
Laser 3 output power [%] |
|
laser count |
Number of active lasers |
|
lasers installed |
Number of available lasers |
|
sample rate |
Trace sample rate [Hz] |
|
samples per event |
Samples per event |
|
signal max |
Upper voltage detection limit [V] |
|
signal min |
Lower voltage detection limit [V] |
|
trace median |
Rolling median filter size for traces |
fmt_tdms |
parsed |
description [units] |
|---|---|---|
video frame offset |
Missing events at beginning of video |
imaging |
parsed |
description [units] |
|---|---|---|
flash device |
Light source device type |
|
flash duration |
Light source flash duration [µs] |
|
frame rate |
Imaging frame rate [Hz] |
|
pixel size |
Pixel size [µm] |
|
roi position x |
Image x coordinate on sensor [px] |
|
roi position y |
Image y coordinate on sensor [px] |
|
roi size x |
Image width [px] |
|
roi size y |
Image height [px] |
online_contour |
parsed |
description [units] |
|---|---|---|
bin area min |
Minium pixel area of binary image event |
|
bin kernel |
Odd ellipse kernel size, binary image morphing |
|
bin threshold |
Binary threshold for avg-bg-corrected image |
|
image blur |
Odd sigma for Gaussian blur (21x21 kernel) |
|
no absdiff |
Avoid OpenCV ‘absdiff’ for avg-bg-correction |
online_filter |
parsed |
description [units] |
|---|---|---|
area_ratio max |
Maximum porosity |
|
area_ratio min |
Minimum porosity |
|
area_ratio soft limit |
Soft limit, porosity |
|
area_um max |
Maximum area [µm²] |
|
area_um min |
Minimum area [µm²] |
|
area_um soft limit |
Soft limit, area [µm²] |
|
aspect max |
Maximum aspect ratio of bounding box |
|
aspect min |
Minimum aspect ratio of bounding box |
|
aspect soft limit |
Soft limit, aspect ratio of bbox |
|
deform max |
Maximum deformation |
|
deform min |
Minimum deformation |
|
deform soft limit |
Soft limit, deformation |
|
fl1_max max |
Maximum FL-1 maximum [a.u.] |
|
fl1_max min |
Minimum FL-1 maximum [a.u.] |
|
fl1_max soft limit |
Soft limit, FL-1 maximum |
|
fl2_max max |
Maximum FL-2 maximum [a.u.] |
|
fl2_max min |
Minimum FL-2 maximum [a.u.] |
|
fl2_max soft limit |
Soft limit, FL-2 maximum |
|
fl3_max max |
Maximum FL-3 maximum [a.u.] |
|
fl3_max min |
Minimum FL-3 maximum [a.u.] |
|
fl3_max soft limit |
Soft limit, FL-3 maximum |
|
size_x max |
Maximum bounding box size x [µm] |
|
size_x min |
Minimum bounding box size x [µm] |
|
size_x soft limit |
Soft limit, bounding box size x |
|
size_y max |
Maximum bounding box size y [µm] |
|
size_y min |
Minimum bounding box size y [µm] |
|
size_y soft limit |
Soft limit, bounding box size y |
|
target duration |
Target measurement duration [min] |
|
target event count |
Target event count for online gating |
setup |
parsed |
description [units] |
|---|---|---|
channel width |
Width of microfluidic channel [µm] |
|
chip region |
Imaged chip region (channel or reservoir) |
|
flow rate |
Flow rate in channel [µL/s] |
|
flow rate sample |
Sample flow rate [µL/s] |
|
flow rate sheath |
Sheath flow rate [µL/s] |
|
identifier |
Unique setup identifier |
|
medium |
Medium used |
|
module composition |
Comma-separated list of modules used |
|
software version |
Acquisition software with version |
|
temperature |
Mean chip temperature [°C] |
Example: date and time of a measurement
In [1]: import dclab

In [2]: ds = dclab.new_dataset("data/example.rtdc")

In [3]: ds.config["experiment"]["date"], ds.config["experiment"]["time"]
Out[3]: ('2017-07-16', '19:01:36')
Analysis metadata
In addition to metadata, dclab also supports a user-defined analysis configuration which is usually part of a specific analysis pipeline and thus not considered to be experimental metadata.
calculation |
parsed |
description [units] |
|---|---|---|
crosstalk fl12 |
Fluorescence crosstalk, channel 1 to 2 |
|
crosstalk fl13 |
Fluorescence crosstalk, channel 1 to 3 |
|
crosstalk fl21 |
Fluorescence crosstalk, channel 2 to 1 |
|
crosstalk fl23 |
Fluorescence crosstalk, channel 2 to 3 |
|
crosstalk fl31 |
Fluorescence crosstalk, channel 3 to 1 |
|
crosstalk fl32 |
Fluorescence crosstalk, channel 3 to 2 |
|
emodulus medium |
Medium used (e.g. CellCarrierB, water) |
|
emodulus model |
Model for computing elastic moduli |
|
emodulus temperature |
Chip temperature [°C] |
|
emodulus viscosity |
Viscosity [Pa*s] if ‘medium’ unknown |